Pipeline Data Agent - Pipeline Analytics with Google ADK
Overview
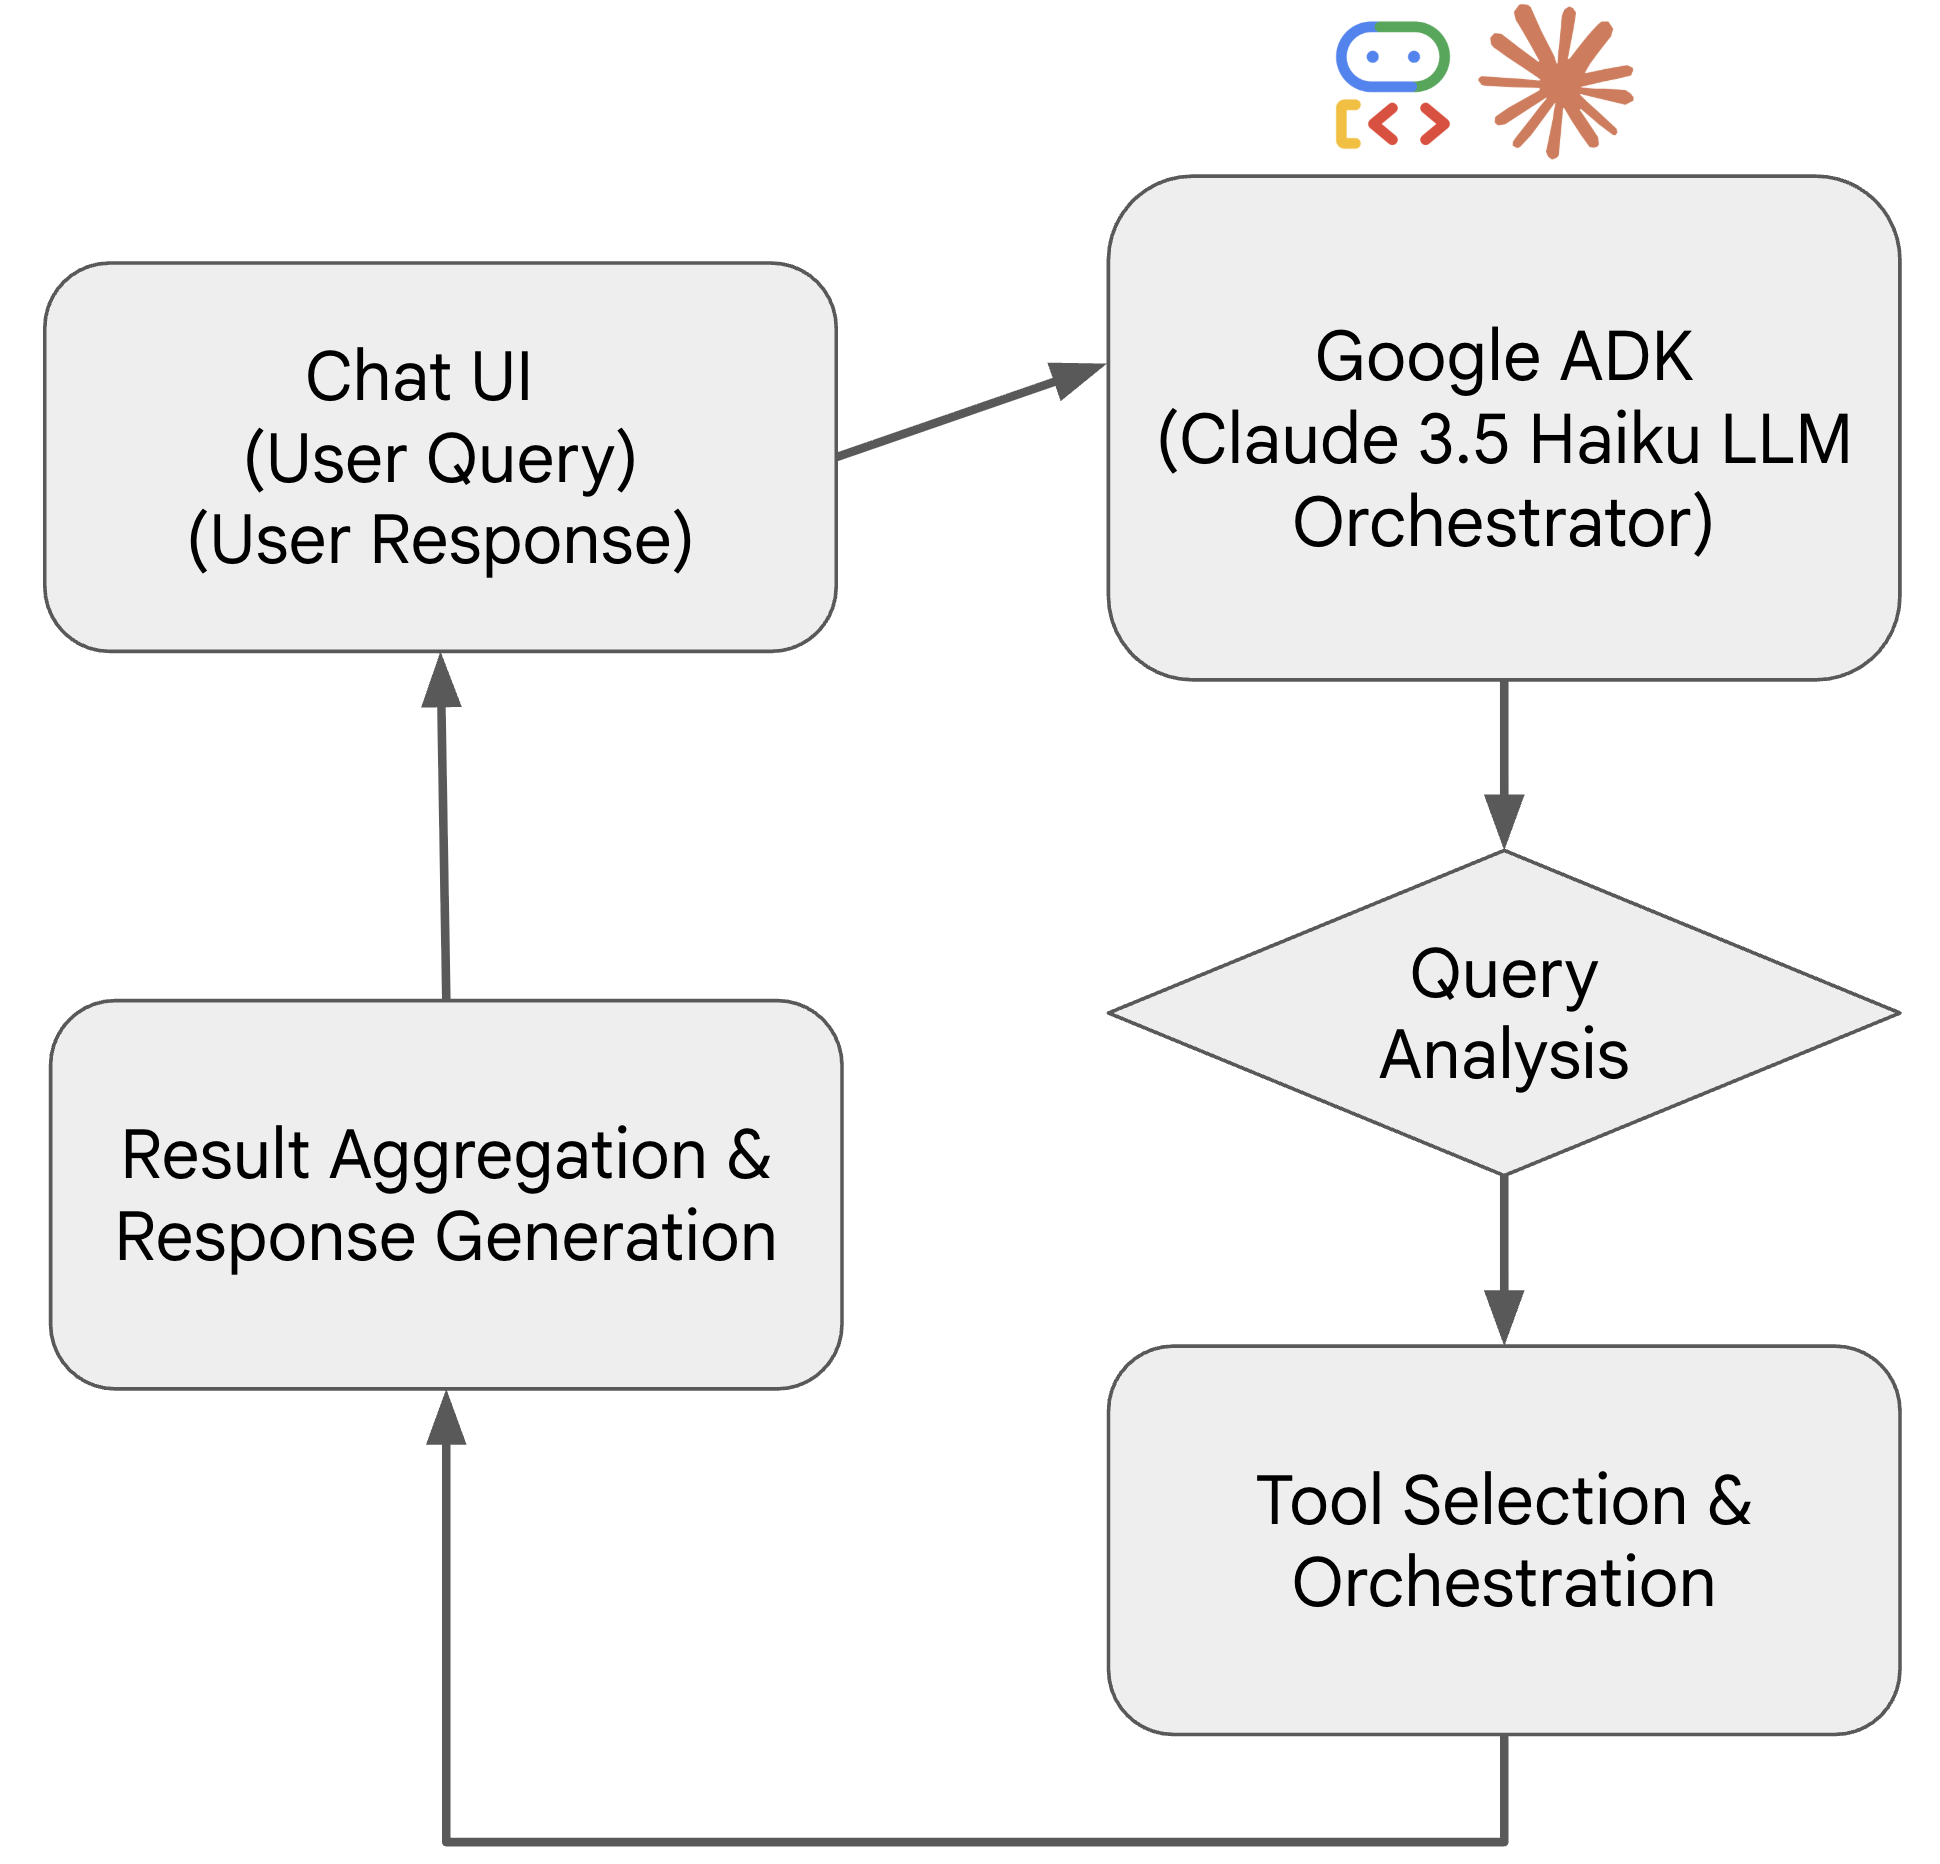
This project demonstrates the power of Google’s Agent Development Kit (ADK) combined with Claude 3.5 Haiku to create an intelligent data analysis agent. The agent processes a massive pipeline dataset (23.8M+ records) and can handle queries ranging from simple data retrieval to complex pattern recognition and anomaly detection.
Key Components
- Google ADK Architecture – Implements ADK’s modular design patterns with high-level, flexible tools that the LLM orchestrates dynamically.
- Pipeline Data Processing – Analyzes 13-column dataset with pipeline names, scheduled quantities, gas days, receipt/delivery indicators, categories, and state information.
- Three-Tier Tool System – Organized into Retrieval Tools (basic queries), Pattern Tools (clustering & correlations), and Anomaly Tools (outlier detection).
- LLM Orchestration – Claude 3.5 Haiku combines multiple tool calls to solve complex analytical queries without requiring specific functions for each use case.
Technical Architecture
- Retrieval Layer – Volume aggregation, pipeline ranking, net flow calculations, time series analysis
- Pattern Recognition – Seasonal analysis, monthly trends, correlation detection, K-means clustering
- Anomaly Detection – Multi-method outlier detection using z-score, rolling windows, change detection, and percentile-based methods
- Modular Design – Tools are composable and reusable across different query types, following ADK best practices
Applications
- Pipeline Operations – Monitor gas flow patterns across utilities, industrial, production, and storage categories
- Seasonal Analysis – Identify seasonal trends and compare winter vs. summer delivery patterns
- Anomaly Detection – Automatically detect unusual pipeline activities and transaction outliers
- Multi-dimensional Analytics – Aggregate data across time, geography, and transaction types for comprehensive insights
Dataset Scope
The agent processes pipeline transaction data with:
- 23.8M+ Records across utilities (LDC), industrial, production, and storage categories
- Transaction Types – Receipts (+1 inflow) vs deliveries (-1 outflow)
- Geographic Coverage – State-level pipeline activity analysis
- Temporal Analysis – Multi-granularity time series from daily to yearly patterns